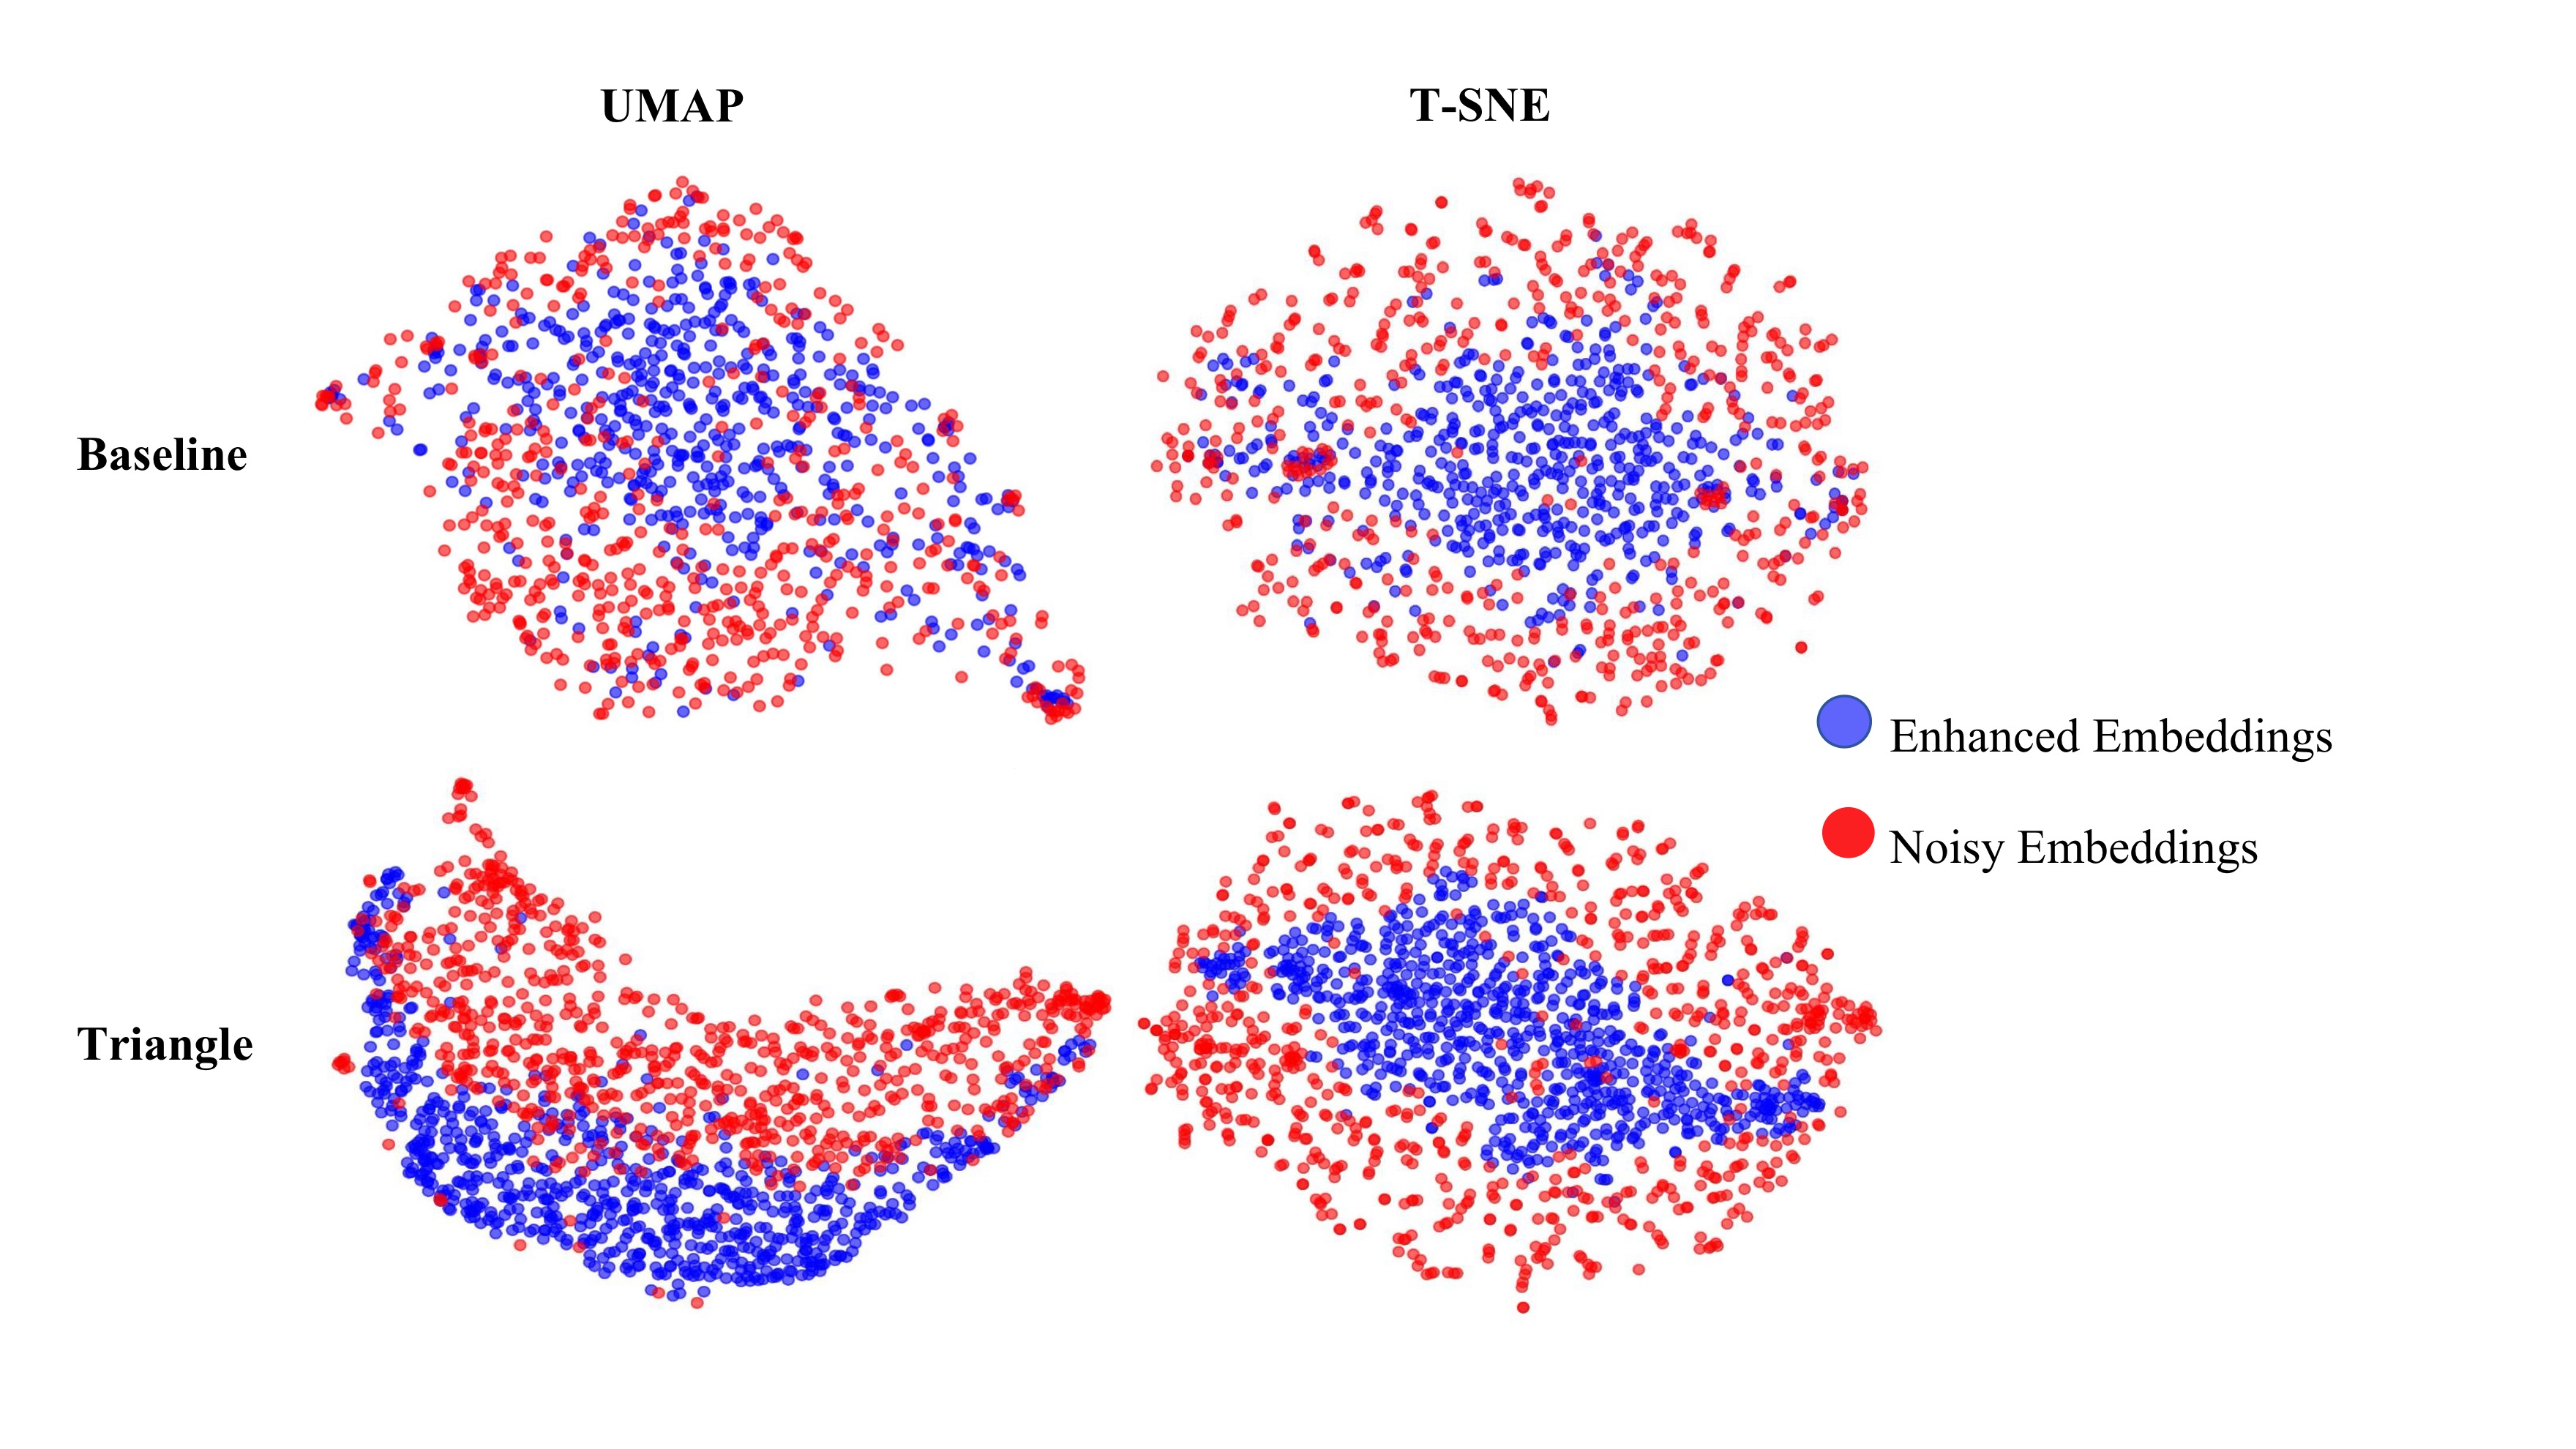
Visualization of latent embeddings using UMAP and t-SNE. Blue points denote noisy embeddings (the output of last Nn codebooks), and red points denote enhanced embeddings (the mean of first Ne codebooks).
The top row shows the baseline model, where noisy and enhanced representations largely overlap. The bottom row corresponds to the proposed triangle (variance-ordered) quantization structure, which exhibits clearer structural separation and more organized distribution patterns.